I think it´s time for me to go through my list of Tableau advantages. You can do a lot of them in other tools like Qlik, OBIEE, PowerBI, Watson and Lumira but mostly it isnt that simple.
1: Drill
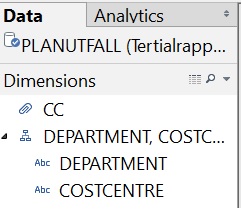
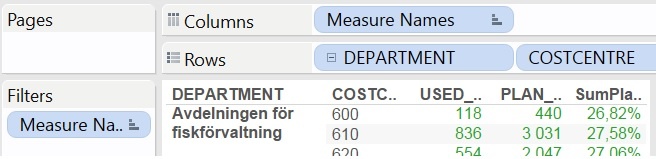
Drilling is very useful when you want to dig deeper from an overview down to detail.
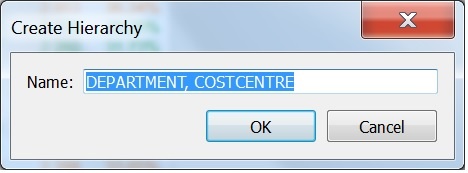
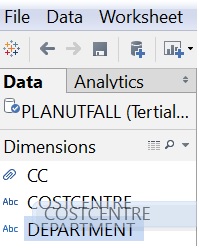
In Tableau simple drag and drop details to parent level. In my example I wanted to be able to drill from department to costcentre. So I drag and drop costcentre over department. After giving it a name it´s placed in the dimension window.
Then in your analysis just drag and drop your hierarchy to rows or columns.
The minus or plus sign before department helps me to expand or compact my analyse.
2 Filter action for dashboards
It´s very simple in a Tableau dashboard to decide how the worksheets should filter each other, just mark them Use as Filter
To navigate and filter Tableau uses Filter Actions.
Click US in the dashboard to show more information about the medals.
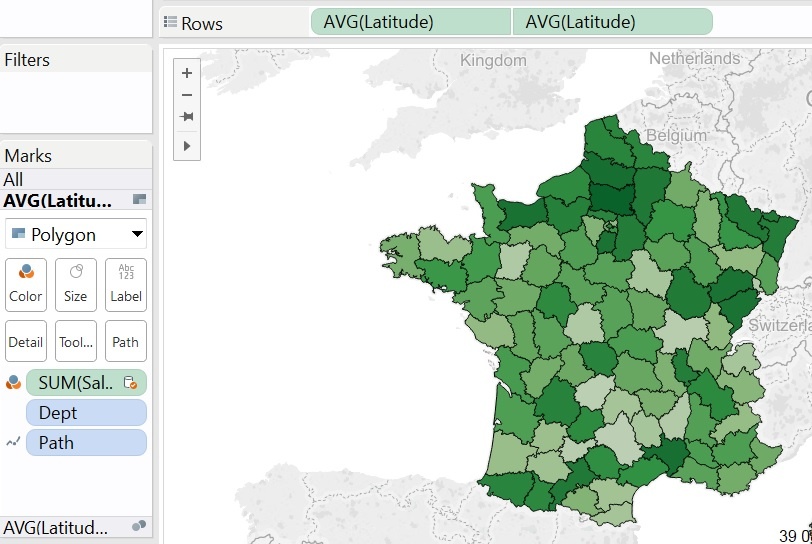
3 Dual axes analysis
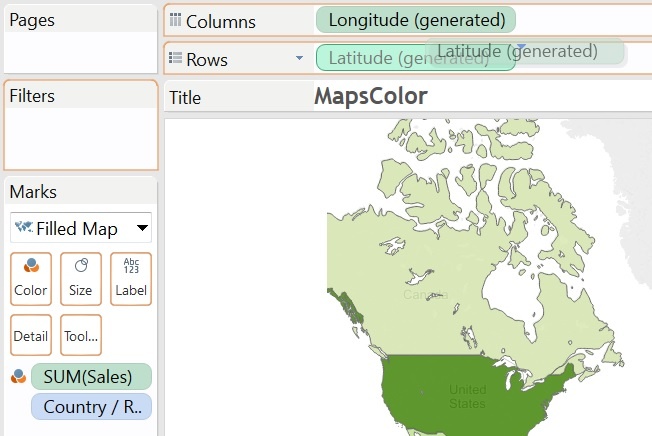
Using dual axis in Tableau gives you a lot of possibilities to change colors, graph type, format and help lines.
To create dual axes just drop your data to right side of the worksheet.
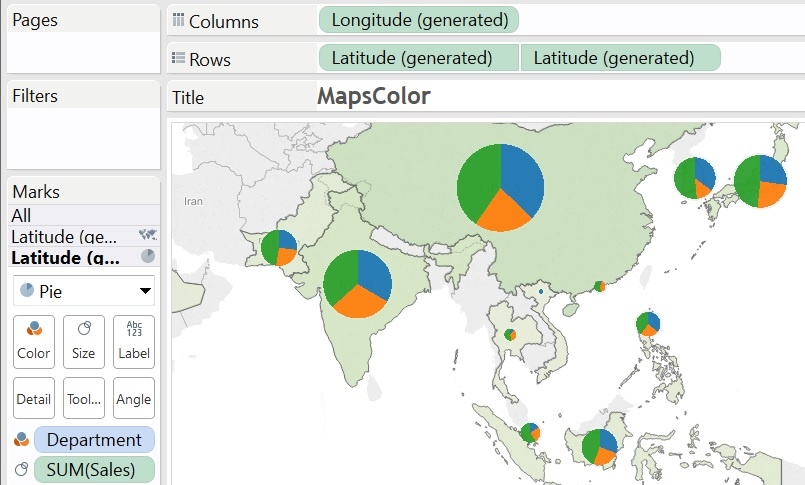
For graphs you simple create a map by drag and drop some position based column to Detail.
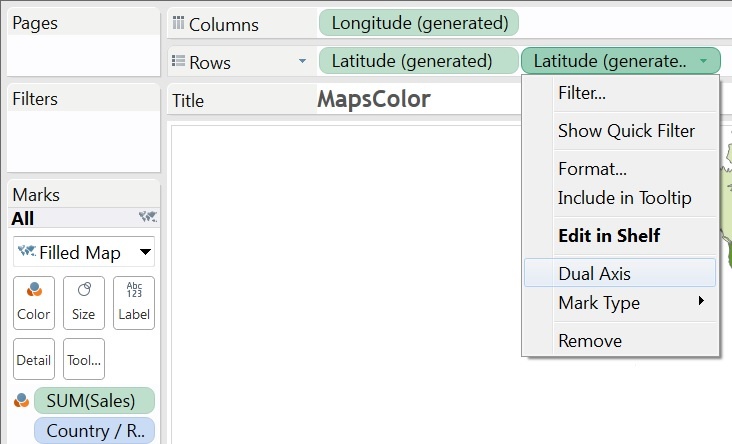
In my example press CTRL and drag Latitude to Rows to duplicate the values. Then right click and choose Dual Axes.
To create dual axes for pie charts or other marks on map just right click and select dual axis.
Then on the marks card select pie as sales visualization
4 Infographics
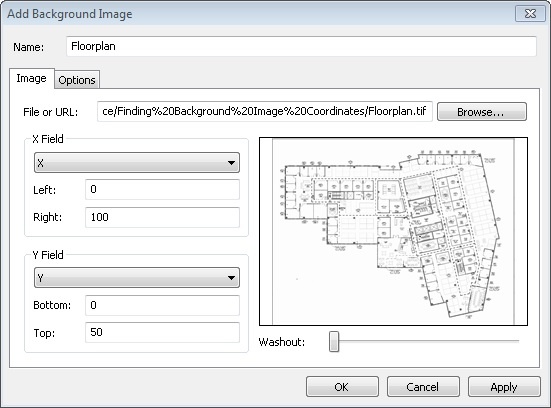
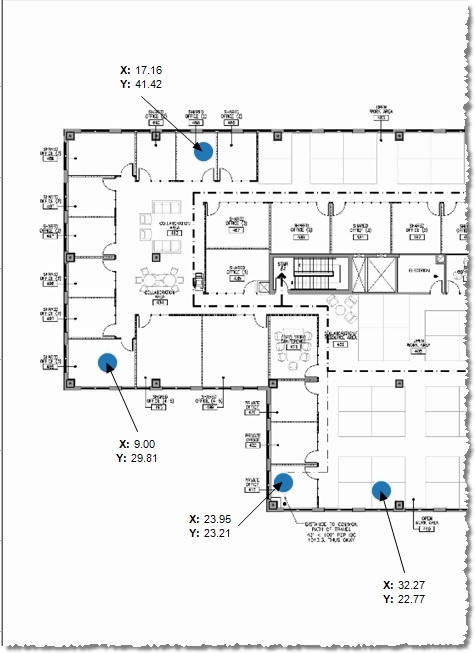
In Tableau it is possible to get information about where to put information on pictures.
When you have found position to use. Put in information there. Pictures can also be animated.
For an example check
http://kb.tableau.com/articles/knowledgebase/background-image-coordinates
5: Automatic date dimension hierarchy
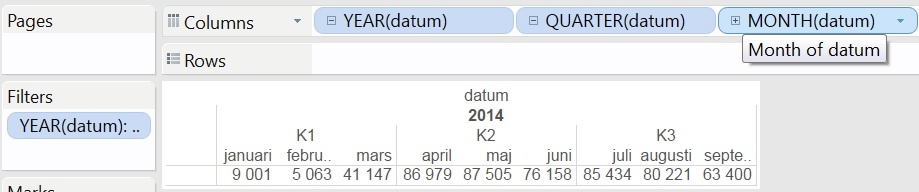
In a Tableau table you don´t need to add date dimensions. Tableau knows from start how to aggregate and display dates. If you need to change something regarding dates you can customize dates by your self.
Tableau automatic creates a plus sign when dates has been loaded to columns or rows for drilling.
6: Dynamic sets in Tableau
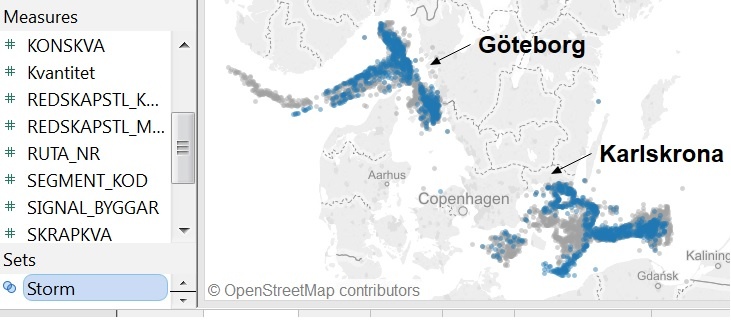
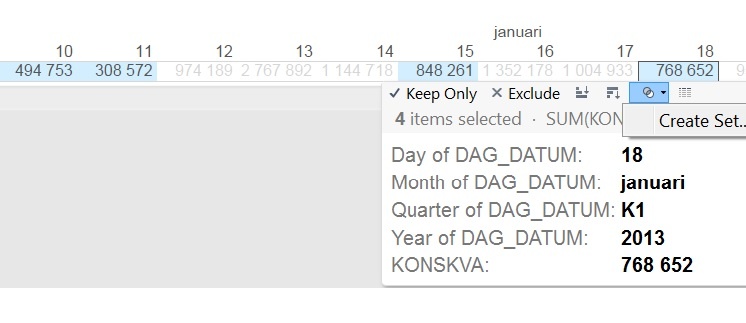
Something that is really powerful in Tableau is set. You decide what´s interesting to watch. That could be some countries or some poor performance products. Just mark the data you want to create a set around. Do your analysis and then compare it by applying different sets.
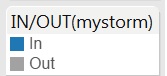
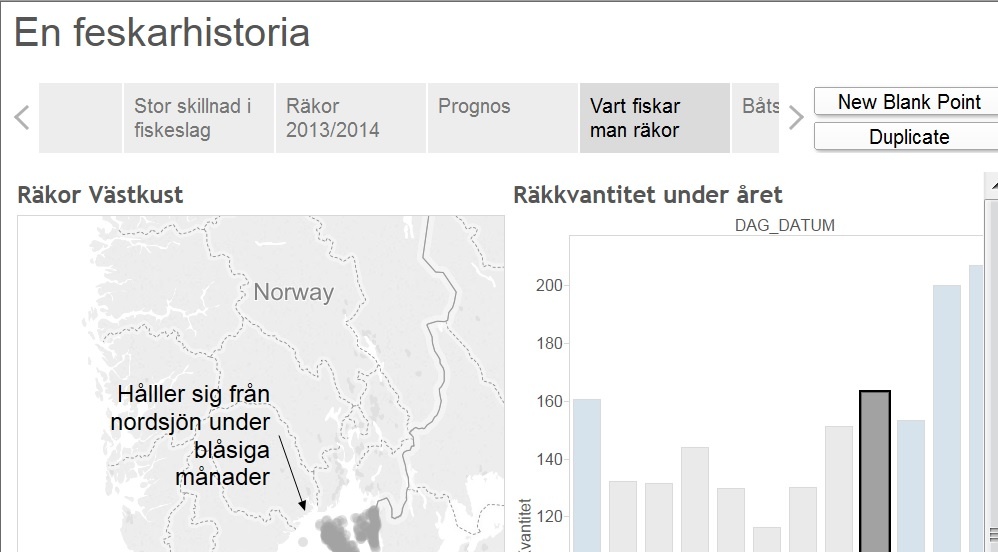
In my example I wanted to show how fishing are affected by storm.
I did known a couple of date when storm arrives. I created a set for that and then applied the set to the fishing data
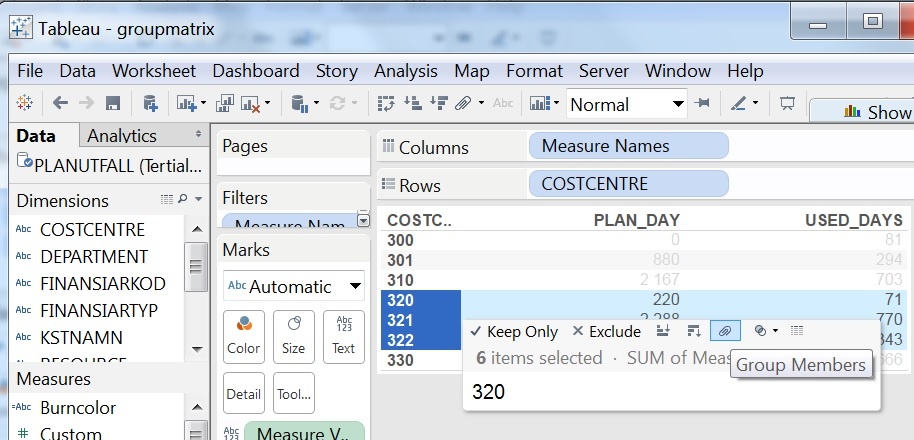
Another powerful thing in Tableau is groups. If you want to group together data for specific subtotals or you want to take away some exceptions use groups.
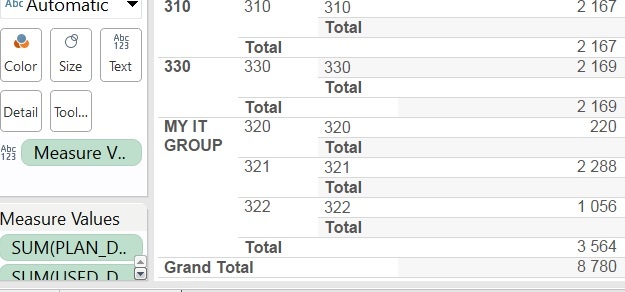
In my example I wanted to collect some cost centre to create an IT-group.
I just mark three costcentre then right click and merge them together as a group.
I give the group a name. Now I can summarize the group, take my group data away or dig deeper into this group.
To add totals, just go into analysis menu and add subtotals.
8: Data blending
Something I really like with Tableau is data blending. You aggregate a big amount of data in your analyze. Then you realize that you want to compare the aggregated data with something in another database at that summary level. You don’t want to clean the data, you just want to compare it with an outer join.
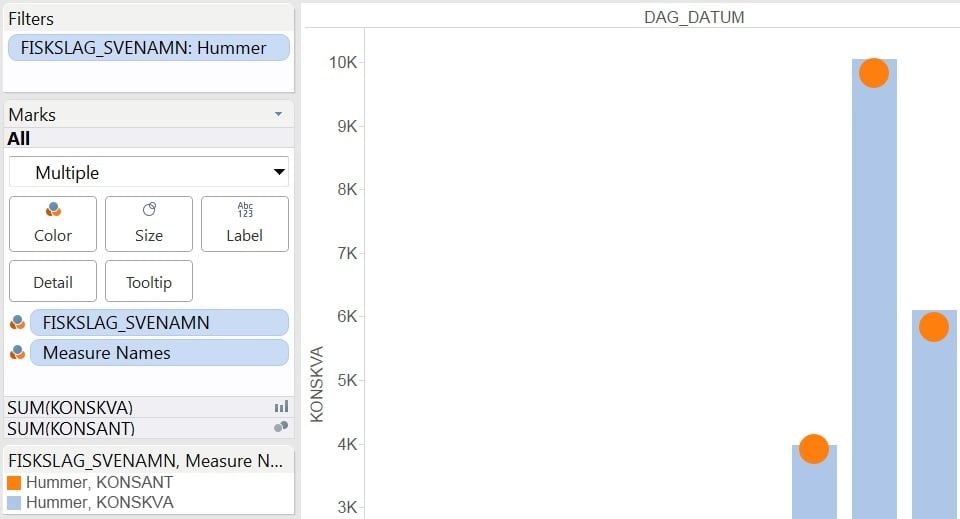
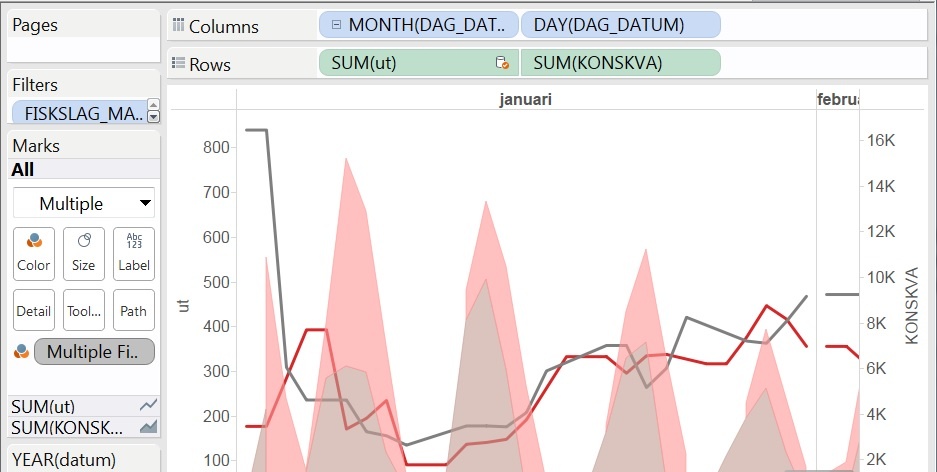
In my example I loaded all fishing during a year with a lot of dimensions. Then I got the scrimp price per day from another source. In Tableau I just blended the legal source data with the scrimp webdata on date values.
Date is here joined with date from my legal datasource.
This dual axes blended analyse showed me how scrimp prices changes when big boats arrives.
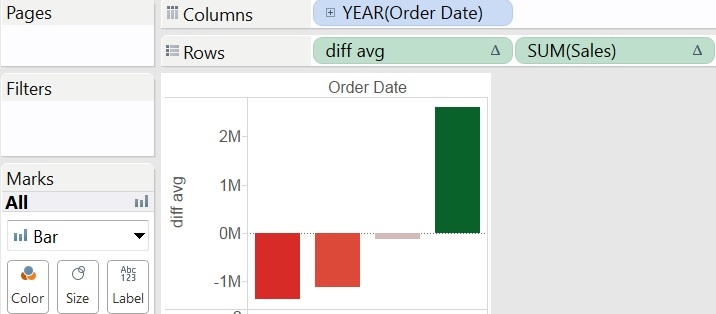
9: Table calculations
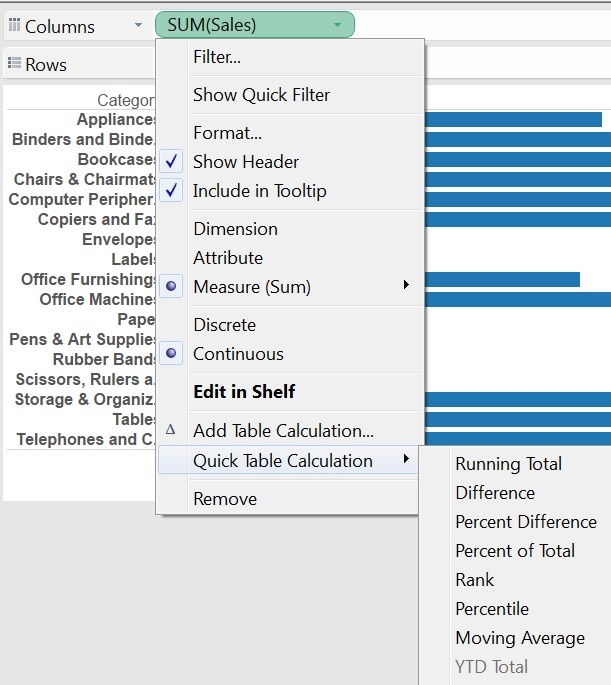
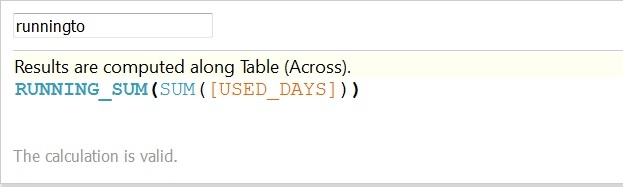
Something that helps Tableau users a lot is table calculations. You run these predefined computations direct against your data view. There is a lot useful table calculations like Running Totals, Difference, Percent Difference, Percent of total, Rank, Moving average, YTD Total, YTD Growth. These function are able to customize by Pane, partitioning, filter and so on.
Its simple just right click on your measure in your analyze and click Quick Table Calculation
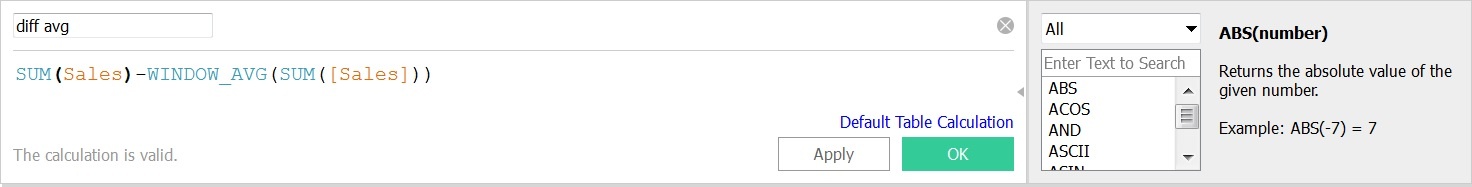
There is also window average that helps you with windows summaries, averages, percent and total in your displaying analysis.
Formulas are also very easy to use and create in Tableau.
Start to create formulas by right click in measure folder. Then start write something to checkout.
10: Stories
Stories is a nice feature in Tableau. When you have created a lot of workbooks and dashboards its time to create a story about your insights.
The story is a powerpoint alike presentation for your analysis. In Tableau you are able to drill and act during the presentation of your story.
Well there is a lot more amazing function in Tableau. I will continue to present more of them in my next blog-post.
/Håkan